Building an MCP server for Cisco SD-WAN
How I built a Model Context Protocol server that lets AI agents query Cisco vManage with a correlation engine that computes root causes in Python.

Most network troubleshooting looks the same: SSH into a device, run show commands, paste the output into a chat, ask someone who's seen the pattern before. With SD-WAN, you're doing that across a controller, a management plane, and potentially dozens of edge devices. The data exists in vManage's REST API, but nobody wants to manually correlate tunnel stats, BFD sessions, alarm counts, and device state to figure out whether a problem is isolated to one router or affecting an entire site.
I built an MCP server that connects AI agents to a live Cisco vManage instance. You ask "What's wrong with the fabric?" in Claude, Copilot, or any MCP client, and it gets back computed health signals with root-cause hypotheses, blast radius, and citations for every conclusion. No raw JSON blobs. No improvised answers from an LLM that doesn't actually understand BFD.
What is MCP and why does it matter here?
The Model Context Protocol is an open standard for connecting AI models to external data sources and tools. Instead of describing your infrastructure in a prompt and hoping the model gets it right, MCP gives the model structured tools it can call to get real data.
For networking, this is the right abstraction. Network state is live, constantly changing, and requires domain-specific reasoning. An LLM reading raw API payloads will make things up. An LLM reading computed signals from a purpose-built engine can explain what's happening accurately.
The server exposes 20 read-only tools: 16 for retrieving data (devices, tunnels, BFD sessions, alarms, policies, interfaces, running configs) and 4 diagnostic tools that correlate data across endpoints.
The core design principle
This is the single most important decision in the whole project: APIs gather facts, Python computes signals, the LLM explains results.
The model never sees raw vManage API payloads and improvises conclusions. Every health signal is computed in Python from specific API data, tagged with the endpoint it came from, and handed to the model as structured output.
Here's what that looks like in practice. Each device gets a computed health assessment:
@dataclass
class HealthSignal:
    """A single computed health observation, grounded in API data."""
    level: HealthLevel        # healthy, degraded, critical, unknown
    component: str            # e.g. "device/dc-cedge01/bfd"
    summary: str              # human-readable one-liner
    detail: str               # full context
    source: DataSource        # e.g. "GET /dataservice/device"
    evidence: dict            # raw values that triggered this signal
When a WAN edge is reachable but reports 0 BFD sessions, the engine flags it as DEGRADED with the source endpoint cited. When a device is completely unreachable with 0 BFD and 0 control connections, it's CRITICAL. The LLM doesn't decide the severity. Python does.
This matters because network troubleshooting is not a creative writing exercise. If the model says "site 100 has a WAN outage," that conclusion should be traceable to specific API responses, not hallucinated from a vague pattern match.
How the correlation engine works
The correlation engine is the part I spent the most time on. Individual health signals are useful, but the real value comes from correlating them across devices and sites.
The pipeline runs in three stages:
1. Collect and compute per-device health. The engine fetches the device list and alarm counts concurrently from vManage, then computes health signals for every device. Each signal records its source endpoint, the raw evidence, and a severity level.
2. Group by site and analyse failure scope. Devices are grouped by site ID. The engine then determines whether a failure is at the device level, site level, transport level, or fabric-wide. The logic is straightforward:
def _analyze_failure_scope(devices, sites) -> ImpactAssessment:
    unreachable = [d for d in devices if not d.reachable]

    # Controllers down = fabric-wide impact
    unreachable_controllers = [d for d in unreachable if d.device_type != "vedge"]
    if unreachable_controllers:
        return ImpactAssessment(scope="fabric-wide", ...)

    # More than half the sites affected = fabric-wide transport
    if len(unreachable_sites) > len(total_sites) * 0.5:
        return ImpactAssessment(scope="fabric-wide", ...)

    # All devices at one site down = site-level outage
    if fully_down_sites and len(unreachable_sites) == 1:
        return ImpactAssessment(scope="site", ...)

    # Individual devices down = device-level issue
    return ImpactAssessment(scope="device", ...)
This is deterministic logic, not a prompt. When all devices at site 100 are unreachable but other sites are fine, the engine says "site-level outage" because that's what the data shows. The LLM then explains it to the operator in natural language.
3. Generate ranked root-cause hypotheses. Based on the failure scope and the specific signals, the engine produces ordered hypotheses with confidence levels, supporting evidence, and suggested next steps.
For example, if a single device is completely isolated (0 BFD, 0 control connections) while other devices at the same site are healthy, the engine generates a high-confidence hypothesis: "device-specific failure, not transport-wide." The evidence includes the BFD and control connection counts. The suggested checks include verifying physical WAN connectivity and reviewing recent config changes.
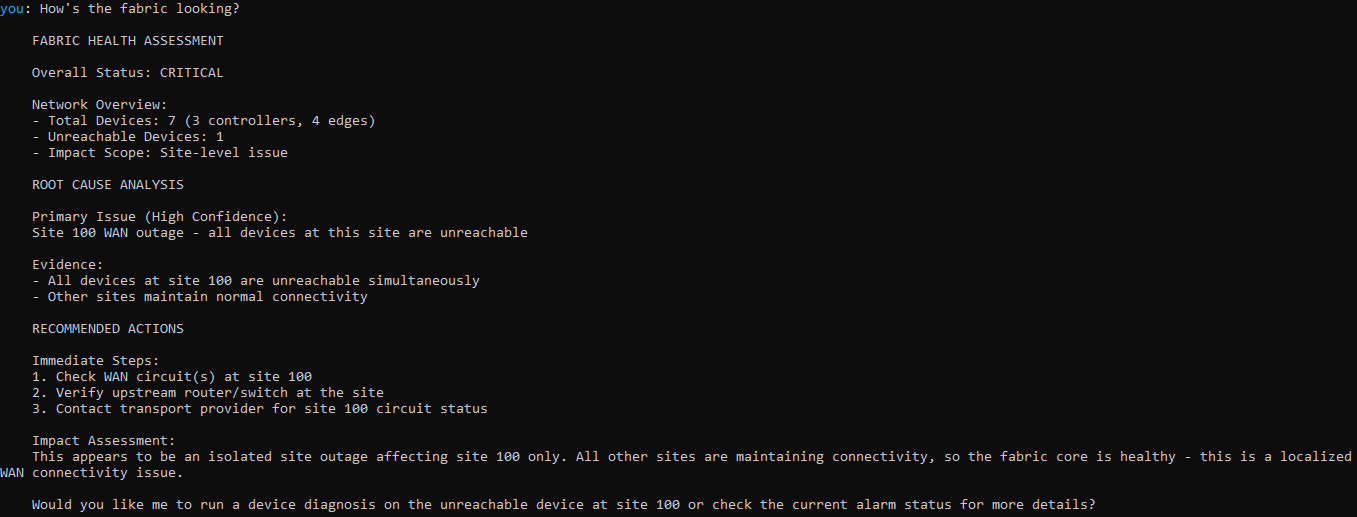
The output looks like this:
## Fabric Health: CRITICAL

### Devices
- Controllers: 3 (3 reachable)
- WAN Edges: 4 (3 reachable, 1 unreachable)

### Impact Assessment
- Scope: **site**
- All devices at site 100 are unreachable.
  Other sites maintain connectivity.

### Root-Cause Hypotheses
1. Site 100 WAN outage (confidence: high)
   - All devices at site 100 are unreachable simultaneously
   - Suggested checks: Check WAN circuit(s), verify upstream router

### Data Sources
- GET /dataservice/device: OK (234ms)
- GET /dataservice/alarms/count: OK (156ms)
Every conclusion cites its source. If the alarm endpoint failed, the narrative says so explicitly: "This assessment is partial. Alarm-related conclusions may be incomplete."
Why partial results matter more than you'd think
Network APIs fail. Endpoints time out. Rate limits kick in. A system that returns nothing when one out of five API calls fails is useless in a production incident.
The engine tracks every API fetch individually using a DataFetchResult with success/failure status, duration, and any error message:
@dataclass
class DataFetchResult:
    source: DataSource
    success: bool
    data: dict | list | None = None
    error: str | None = None
    duration_ms: float = 0.0
If the device list succeeds but alarm counts fail, the report still includes device health signals. It just marks itself as partial and lists which sources were incomplete. The LLM can tell the operator "I couldn't check alarm data, so the alarm-related conclusions may be missing."
This is more useful than a generic "Error: request failed" message, and it prevents the LLM from silently ignoring the gap in data.
Auth that doesn't break under concurrency
vManage uses session-based authentication: you POST credentials to /j_security_check, get a JSESSIONID cookie, then fetch an XSRF token from /dataservice/client/token. Every subsequent request needs both.
The problem with MCP is that multiple tool calls can fire concurrently. If two tools try to authenticate at the same time, they stomp on each other's sessions. If a session expires mid-query, you need to re-authenticate without corrupting in-flight requests.
This is one of several projects I've built combining AI tooling with real infrastructure. You can see the full list on my projects page.
The solution is compare-and-swap re-authentication behind an asyncio.Lock:
async def reauthenticate(self, stale_token: str | None = None) -> None:
    async with self._auth_lock:
        if stale_token is not None and self._token != stale_token:
            return  # another coroutine already refreshed
        self._token = None
        await self._authenticate_locked()
When a request gets a 401/403, it captures the current token and calls reauthenticate with it. If another coroutine already refreshed the token while we waited for the lock, the captured token won't match the current one, so we skip re-auth. This prevents thundering herd re-authentication when multiple tool calls hit a session expiry at the same time.
On top of that, every request retries with exponential backoff for transient failures (429, 500-504). The backoff caps at 10 seconds and the retry count defaults to 3, both configurable.
Audit logging and safety
Every tool call gets logged as structured JSON: timestamp, tool name, parameters, result summary, and duration. Credentials are automatically redacted through a recursive filter that catches passwords and tokens no matter how deeply nested they are in the parameters:
_REDACT_FIELDS = frozenset({
    "password", "j_password", "secret", "token", "api_key",
    "VMANAGE_PASSWORD", "VMANAGE_USERNAME",
    "X-XSRF-TOKEN", "JSESSIONID", "cookie",
})
All 20 tools are read-only (GET only). No POST, PUT, or DELETE. Every tool carries MCP annotations (readOnlyHint: true, destructiveHint: false) so the LLM client knows it's safe to call without human approval. This is a deliberate constraint: querying network state should never risk modifying it.
What does the natural language CLI look like?
Beyond the MCP server itself, I built an interactive console that supports Claude, OpenAI, and Gemini as the conversation layer. You pick your provider, enter your API key, and ask questions in plain English:
The CLI boots with an animated sequence that authenticates, discovers the fabric topology, and checks for alarms before dropping you into the shell:
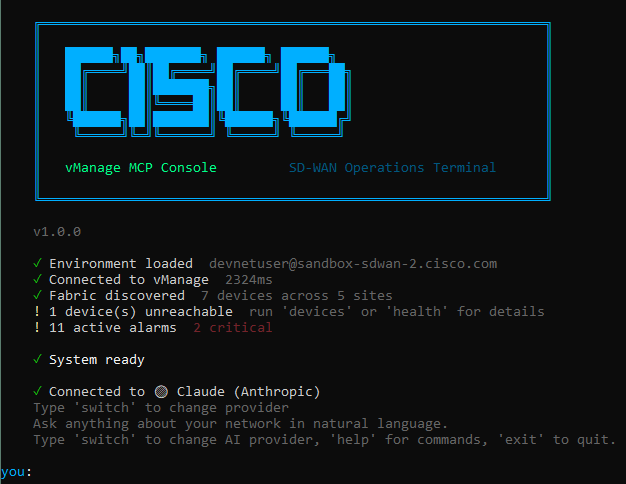
Built-in commands (devices, health, alarms, diagnose <ip>) work without an AI provider. When AI is connected, natural language queries are matched to tools using regex intent patterns first, falling back to the LLM for anything more complex.
All three providers use the same tool definitions and the same system prompt. The AI sees structured JSON from the correlation engine and formats it for the terminal. It never fabricates data because the tools fetch from a live vManage instance.
What I'd do differently
If I were starting over, I'd change a few things.
The asyncio.Lock for auth works fine, but a token bucket would handle the rate-limit retry more elegantly. Right now, three concurrent requests that all hit a 429 will each back off independently. A shared rate limiter would be smarter.
I'd also add more transport-level correlation. The current engine correlates BFD, control connections, and reachability, but doesn't yet look at interface error counters or tunnel jitter/latency patterns to infer transport degradation before devices go fully unreachable. That's the next iteration.
And the test suite, while covering 46 cases across health signals, correlation, audit redaction, and error handling, could benefit from integration tests against the DevNet sandbox. Right now, all tests use mocked API responses, which is fast and deterministic, but misses real-world edge cases in the API payloads.
Is this approach worth it for other APIs?
The pattern - deterministic computation layer between the API and the LLM - works well beyond network monitoring. Any domain where the LLM might hallucinate conclusions from complex data benefits from computing signals first and letting the model explain them.
Financial data, infrastructure metrics, security logs: same principle. Gather the raw data, compute the signals with tested logic, and hand the model structured results to explain. The model is good at explanation and summarisation. It's bad at math and correlation. Play to each side's strengths.
Key Takeaways
- Compute health signals in code, not in prompts. The LLM explains results; it doesn't compute them.
- Cite every conclusion. If the model says 'site 100 has a WAN outage,' the operator should see which API endpoint that came from.
- Handle partial results explicitly. One failed API call shouldn't hide the results from the other four.
- Protect concurrent auth with compare-and-swap, not just a simple lock.
- Read-only by design. Monitoring tools should never risk modifying the system they're observing.
If you're building MCP servers or thinking about connecting AI agents to live infrastructure, I've done this pattern a few times now. Get in touch and I'll walk you through the tradeoffs.